
The hidden economics that are killing your device business
“Isn’t high device churn actually good for business? More churn means more sales, right?”
This question comes up in every executive meeting when discussing wearable retention strategies. On the surface, the logic seems sound: if users abandon their devices after 6 months, they’ll need to buy new ones, creating recurring hardware revenue. But this thinking reveals a fundamental misunderstanding of wearable economics that’s quietly destroying value across the industry.
The math tells a different story—one where high churn is actually a symptom of a broken business model, not a feature.
The Customer Acquisition Reality Check
The first crack in the “churn is good” theory appears when you examine customer acquisition costs. Recent data show that mobile app customer acquisition costs have surged 222% over the past decade, rising from $19 to $29 per user [1]. For fitness-focused applications, the numbers are even more sobering: acquiring an in-app buyer costs $74.68, while subscription customers cost $64.27 to acquire [2].
For fitness centers, the average customer acquisition cost sits at $118 per client [3]. When you extrapolate these figures to wearable devices—which require similar marketing investments, retail partnerships, and brand building—the true cost of replacement becomes clear.
Consider this: if you’re spending $50-150 to acquire each wearable customer (a conservative estimate based on industry benchmarks), and they abandon the device after 6 months, you’re in a constant battle to replace lost customers rather than building sustainable value from existing ones.
The Geographic Evidence
Recent market data reveals telling patterns about device adoption and abandonment across key markets:
India: The Low-Cost Trap India represents approximately 8.5% of population penetration (119 million units among ~1.4 billion people) but leads globally in total shipment volumes [4,5]. The market experienced 34% growth in 2023, reaching 134.2 million units [5]. However, industry analysis reveals that “watch lifecycles are as short as 6 months” due to “lackluster tracking performance leading to high abandonment” [6]. The smartwatch market actually declined 4.5% in 2024, partly due to an “influx of low-cost options” that created elevated inventory levels [7].
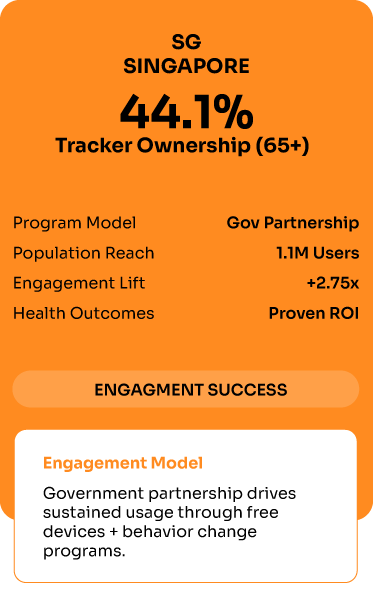
Singapore: The Engagement Success Story Singapore demonstrates the alternative model. With 44.1% fitness tracker ownership among older adults, driven by the National Steps Challenge providing free devices [8], the country shows how government partnership and engagement-focused strategies can drive sustained usage rather than churn.
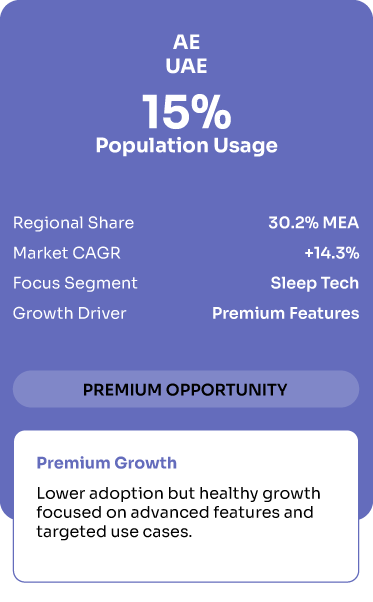
UAE: The Premium Opportunity The UAE represents 30.2% of the Middle East & Africa wearable market, with 15% of the population using fitness trackers in 2023 [9]. The market shows healthy 14.3% CAGR growth, suggesting that focusing on engagement rather than replacement drives sustainable expansion.
Wearable Market Models: Churn vs Engagement vs Premium
Three approaches, three outcomes
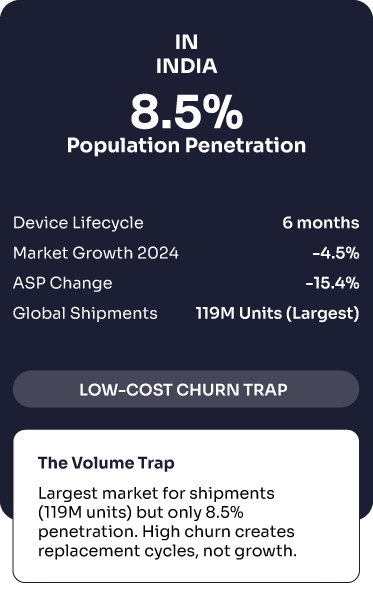
The Volume Trap
Largest market for shipments (119M units) but only 8.5% penetration. High churn creates replacement cycles, not growth
Engagement Model
Government partnership drives sustained usage through free devices + behavior change programs.
Premium Growth
Lower adoption but healthy growth focused on advanced features and targeted use cases.
The Business Model Math Problem
The fundamental issue lies in the economics of one-time hardware sales versus recurring subscription revenue. Modern business theory emphasizes that Customer Lifetime Value (LTV) should be at least 3x higher than Customer Acquisition Cost (CAC) for a sustainable business model [10].
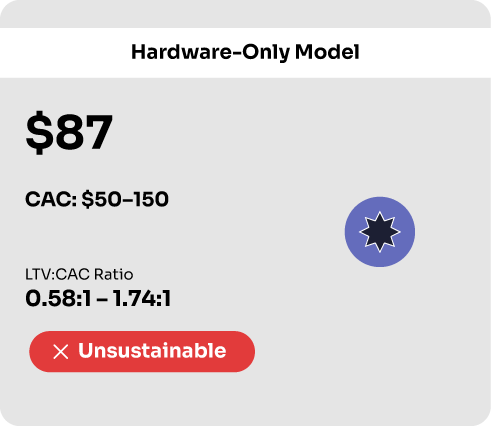
Hardware-Only Model:
• CAC: $50-150 per customer
• Average selling price: $87 per device (Fitbit example) [11]
• If customer churns after 6 months: LTV = $87
• LTV:CAC ratio = 0.58:1 to 1.74:1 (unsustainable)
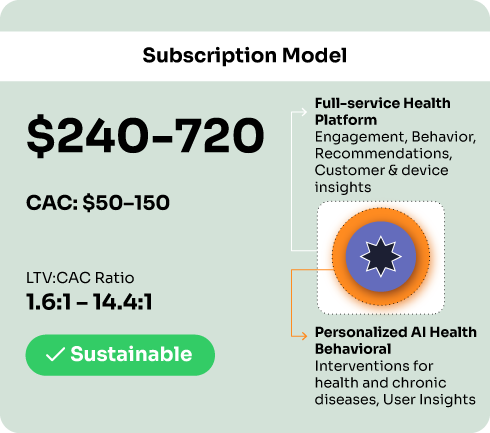
Subscription Model:
• CAC: $50-150 per customer
• Monthly subscription: $10-30
• Average customer lifetime: 24+ months with engagement
• LTV = $240-720
• LTV:CAC ratio = 1.6:1 to 14.4:1 (sustainable to excellent)
LTV:CAC Economics: Hardware vs Subscription
Why the “churn is good” business model destroys value
Industry Benchmark: 3:1 LTV:CAC ratio for sustainable growth

The Churn Tax
Each churned customer requires spending another $50-150 to replace while only generating $87 in return.

Subscription Advantage
Higher LTV enables aggressive customer acquisition while maintaining profitability margins

Fitbit’s $7.6B Lesson
Value destroyed by focusing on hardware sales instead of building subscription venue

Competitive Edge
Companies with 3:1+ can outspend competitors on marketing and stay profitable
The Fitbit Case Study: A $7.6B Lesson
Fitbit’s trajectory provides the most compelling evidence against the “churn is good” thesis. The company’s valuation peaked at $9.7 billion in 2015, crashed to $1.4 billion in 2017, and was eventually acquired by Google for $2.1 billion [11]—representing a 78% value destruction.
Key metrics from Fitbit’s decline:
• Active users: 38.5 million in 2023 (down 3.75%) [11]
• Estimated unit sales: 6.6 million in 2023 [11]
• Financial performance: Unprofitable since 2015, with $320 million loss in 2019 alone
The company sold over 100 million devices but retained only 28 million users—massive churn that prevented the transition to sustainable subscription revenue [12].
The Proxy Indicators of Churn Costs
Without direct access to internal CAC data from major wearable manufacturers, several market indicators reveal the true cost of high churn:
Marketing Spend Escalation Connected fitness companies like Peloton saw sales and marketing expenses “more than doubled to account for 35.3% of total revenue” as they fought customer acquisition battles [13]. This level of marketing spend is unsustainable when customers don’t generate recurring value.
Valuation Compression The wearables industry has experienced widespread valuation compression. Beyond Fitbit’s decline, the broader fitness tracker market shows average selling prices dropping 15.4% in key markets like India, from $25.0 to $21.2 [14].
Market Maturity Signals IDC reports that major markets like the US and India, along with key device categories, are “approaching maturity,” with growth slowing to 4.1% in 2025 [15]. This suggests the easy growth from constant customer replacement is ending.
The Competitive Moat Reality
Companies that solve retention enjoy compounding advantages:
Data Value Appreciation Engaged users generate continuous data streams that improve AI algorithms, enable personalized coaching, and create network effects. Abandoned devices provide zero ongoing data value.
Ecosystem Revenue Opportunities Apple’s approach demonstrates the alternative model: services revenue from engaged users reached $8 billion annually. Accessories, apps, and subscriptions only work with sustained device usage.
B2B Partnership Leverage Corporate wellness programs and insurance partnerships pay for proven health outcomes, not device sales. These relationships require demonstrated user engagement and measurable health improvements.
The Strategic Imperative
The evidence points to a clear conclusion: high wearable churn isn’t a renewable revenue feature—it’s a value destruction mechanism that indicates fundamental product-market fit problems.
For Executives: Track engagement metrics alongside sales numbers. Monitor customer lifetime beyond initial purchase. Measure recurring revenue from services, subscriptions, and partnerships.
For Product Teams: Focus on behavior change outcomes rather than feature proliferation. Build AI-powered coaching that adapts to individual users. Create sustainable habits, not short-term motivation spikes.
For Investors: Look for companies building platform businesses around sustained engagement rather than hardware replacement cycles. Evaluate LTV:CAC ratios and recurring revenue streams as primary value indicators.
The companies that recognize this shift—from hardware churn to engagement sustainability—will capture the majority of the value as the wearables market matures. Those clinging to the “churn is good” thesis will find themselves in an increasingly expensive game of customer replacement, with diminishing returns and compressed valuations.
The choice is clear: build for retention, or watch your competition capture the real value in wearable technology.
References:
[1] Business of Apps. (2025). App User Acquisition Costs (2025). https://www.businessofapps.com/marketplace/user-acquisition/research/user-acquisition-costs/
[2] Appetiser. (2024). Customer Acquisition Cost for Apps: What to Expect in 2024. https://appetiser.com.au/blog/customer-acquisition-cost-for-apps/
[3] WellnessLiving. (2024). Your Ultimate Guide to Customer Acquisition Cost. https://www.wellnessliving.com/blog/ultimate-guide-customer-acquisition-cost/
[4] IDC. (2024). India’s Wearable Device Market Analysis. Various reports indicate approximately 8.5% population penetration despite high shipment volumes.
[5] IDC. (2024). India’s Wearable Device Market Grew 34% in 2023 to 134 Million Units. https://my.idc.com/getdoc.jsp?containerId=prAP51880624
[6] Canalys. Time for change in India’s smart wearable market. https://canalys.com/insights/time-change-india-smart-wearable-market
[7] IDC. (2025). Wearable Devices Market Insights. https://www.idc.com/promo/wearablevendor/
[8] JMIR Aging. (2025). Exploring Smart Health Wearable Adoption Among Singaporean Older Adults. https://aging.jmir.org/2025/1/e69008
[9] Global Growth Insights. (2025). Smart Wearables Market Size, Share | Industry Statistics, 2033. https://www.globalgrowthinsights.com/market-reports/smart-wearables-market-110856
[10] ChartMogul. Customer Lifetime Value (LTV). https://chartmogul.com/saas-metrics/ltv/
[11] Business of Apps. (2025). Fitbit Revenue and Usage Statistics (2025). https://www.businessofapps.com/data/fitbit-statistics/
[12] Coolest Gadgets. Fitbit Customer Base Analysis. Historical acquisition data from industry reports.
[13] Tribe.fitness. The Rising Cost of Customer Acquisition in Connected Fitness. https://www.tribe.fitness/blog/the-rising-cost-of-customer-acquisition-in-connected-fitness
[14] IDC India. India’s Wearable Device Market Analysis 2023-2024.
[15] IDC. (2025). Global Wearables Market Outlook 2025. https://www.idc.com/promo/wearablevendor/
Author:

Novex Alex Human behavior fascinates me—beautifully complex and unsolved, caught between our evolutionary instincts and today's rapidly changing world. There's a persistent gap between what's good for us, what we want, and what we actually do. Today's AI mirrors these same contradictions, yet tomorrow's self-learning technologies hold promise. I'm driven to embrace human diversity and complexity by building adaptive systems that meet people where they are, unlocking small personal changes without compromising autonomy. This approach isn't just compassionate—it's how each person's breakthrough becomes part of humanity's path to lasting transformation.